Exploring Financial News Trends with Natural Language Processing
by Sam Funk
Overview
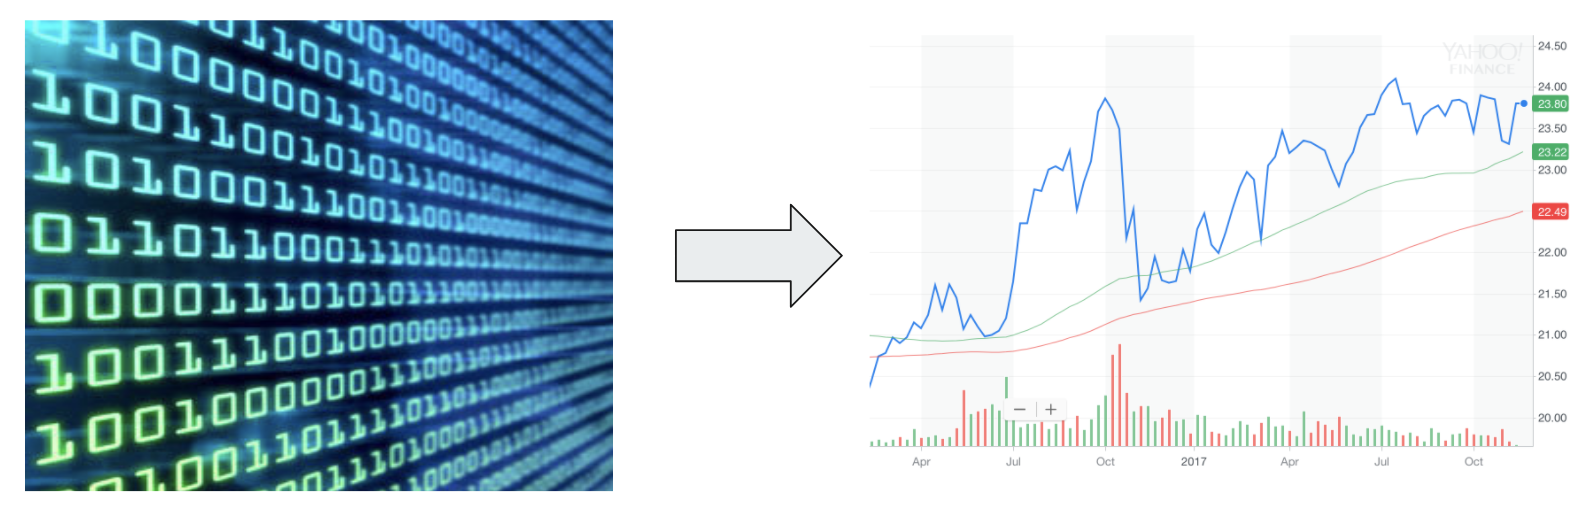
My past two projects touched on the importance of information within finance. In the first, I referenced Eugene Fama and his Efficient Market Hypothesis, which posits that asset prices reflect all available information. In the last, I put forth the notion that a company’s stock price was merely the expected value of all future earnings, which, in order to determine, requires a good deal of corporate information. Both of these projects dealt heavily with numerical metrics and figures. For this project, I wanted to utilize the scores of unstructured textual data within the realm of finance. Specifically, I decided to analyze financial news posts from the site Seeking Alpha. Once I obtained the data, I used Natural Language Processing and Dimensionality Reduction techniques to find topics and trends over time.
Data
The data was obtained from SeekingAlpha.com’s Market News section. Seeking Alpha is a finanical news aggregator with hundreds of contributors and analysts who constantly post content on almost any field of finance imaginable. Every news posts was collected dating back to the beginning of 2013. Each data point consists of the posts title, text, date, and any relevant links. These posts (“documents” moving forward) were stored in a MongoDB as JSON dictionaries. Around 400,000 documents were collected.
Once the data was collected, I began to clean the text and keep only valuable/relevant documents. This meant removing any documents that were related to dividends or earnings because these texts mostly consisted of numbers or words that had little semantic value. Other documents such as ones listing daily stock or index performances were also removed. Since many of these posts are automated, they account for a good portion of all news posts. After removing all the necessary documents, my corpus amounted to around 200,000 documents with roughly 1.5 million unique words.
Finally, I needed to clean the remaining relevant documents. This amounted to removing stop words (common filler words with little semantic value), punctuation, numbers, capital letters, and named-entities. Once all unnecessary characters and words were removed, I used a stemmer to “normalize” each of the words to their base form removing any tenses or suffixes. This process greatly reduces the amount of text in each article, however, it allows for a more thorough analysis as a lot of the noise from useless words has been removed. Now, in order to conduct any analysis, I needed to convert the text into a format that would be able to be interpreted by a computer or program. For this task, I chose the Term-Frequency Inverse-Document-Frequency Vectorizer (TF-IDF). This vectorizer varies from a count vectorizer, which simply counts the frequency of each term in each document, by weighing terms by their frequency in the entire corpus, not only in their respective documents. Now, with vectorized data, I am ready to do some analysis.
Analysis and Results
The issue with doing analysis on data with hundreds of thousands of observations and features is that it is hard to conceptualize and interpret anything in that dimenstion of space. To fix this, we need to employ various dimensionality reduction techniques. In my case, I landed on an algorithm called Non-negative Matrix Factorization (NMF). As it states in the name, NMF requires the data to be non-negative and it can handle sparse data fairly well. NMF takes in a document-word matrix and decomposes it into two component matrices, W and H. W is a document-by-topic matrix and H is a topic-by-word matrix. The value of topic is simply the number of new dimensions one wishes to reduce their data down to. This value requires a good amount of tuning in order to find the optimal number of topics/concepts. The NMF algorothim operates by minimizing the error between the original matrix and the produce of W and H. The resulting weights of W and H allow us to get a better idea of which topics are stronger in certain documents and which words are more prevalent in each topic. With all this in mind, after iterating through the process of cleaning, normalizing, vectorizing, and analyzing my documents, I was able to land on an NMF model that used 15 topics with TF-IDF vectorized features. The final topics (in no particular order) are listed below:
- IPO/SEOs
- Recommendations
- Biotech
- Markets
- Energy
- Management
- Earnings
- Funds
- Federal
- Retail
- Mergers & Acquisitions
- Debt Offering
- Corporate Strategy
- Job Market
- Technology
Some of these topics had overlap with a few of their words, but, for the most, they ended up being distinct. Trying anything above or below 15 topics tended to worsen my results. Looking at the list, the topics seem quite broad. A lot more data would be required in order to pick up nuanced concepts. In the end, I was pleased with my results. The thing with NLP is that there is no concrete metric with which you can measure your results like there is in supervised learning.
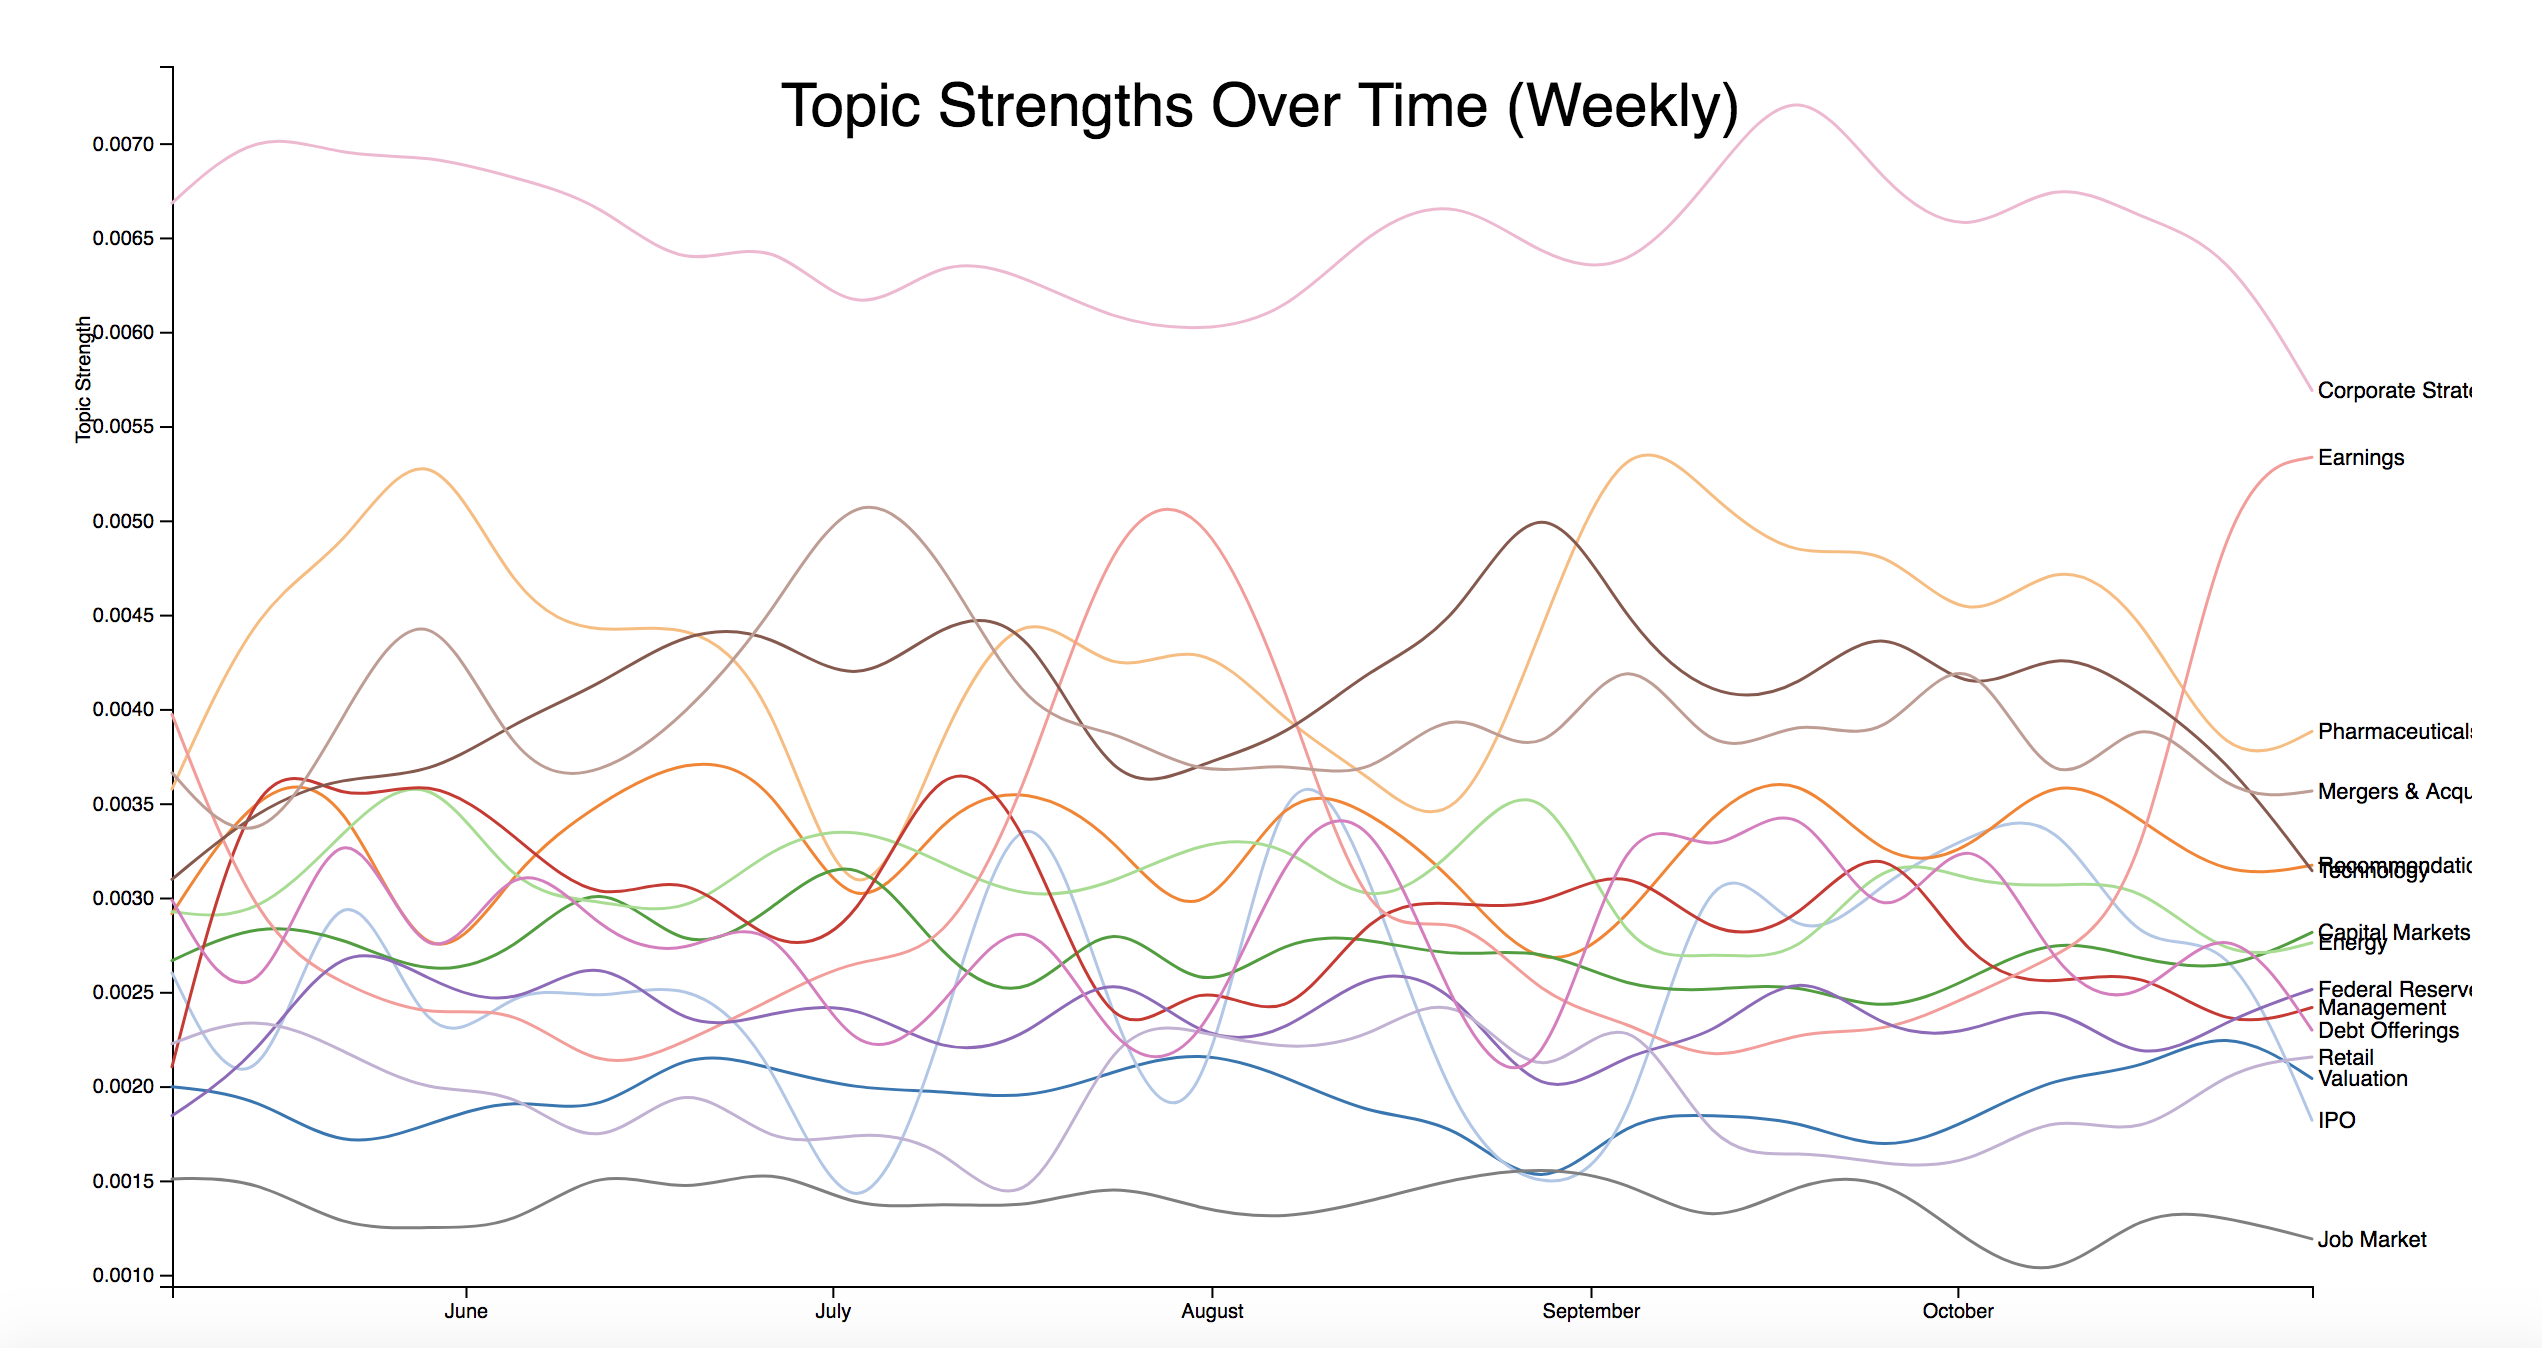
Finally, using my decomposed matrices and knowing when each document occurred I was able to graph the strength of topics over time. The line chart below is for May through the beginning of November of 2017. The data is aggregated on a weekly basis with the average topic strength over all documents in that period being used as the time series data. With the interactive version of the chart, it is easier to pick out specific topic trends. For example, we can see the seasonal trend for earnings documents, which spike around the end of August and October, when companies report their quarterly earnings.
Moving Forward
A chart like this begs for a time series analysis, which would be the next logical step in my analysis. Other improvements and expansions would include using more data sources, subjects, and types. Sentiment analysis could shed some light on the overall sentiment of the economy and markets for a given time period. I also would like to try utilizing a 3-dimensional NMF model to see how the acutal topics change over time not only measuring the aggregating strengths for a given time period.
The presentation for this project can be found here.
Subscribe via RSS