Classifying Earnings Surprise with S&P 500 Metrics
by Sam Funk
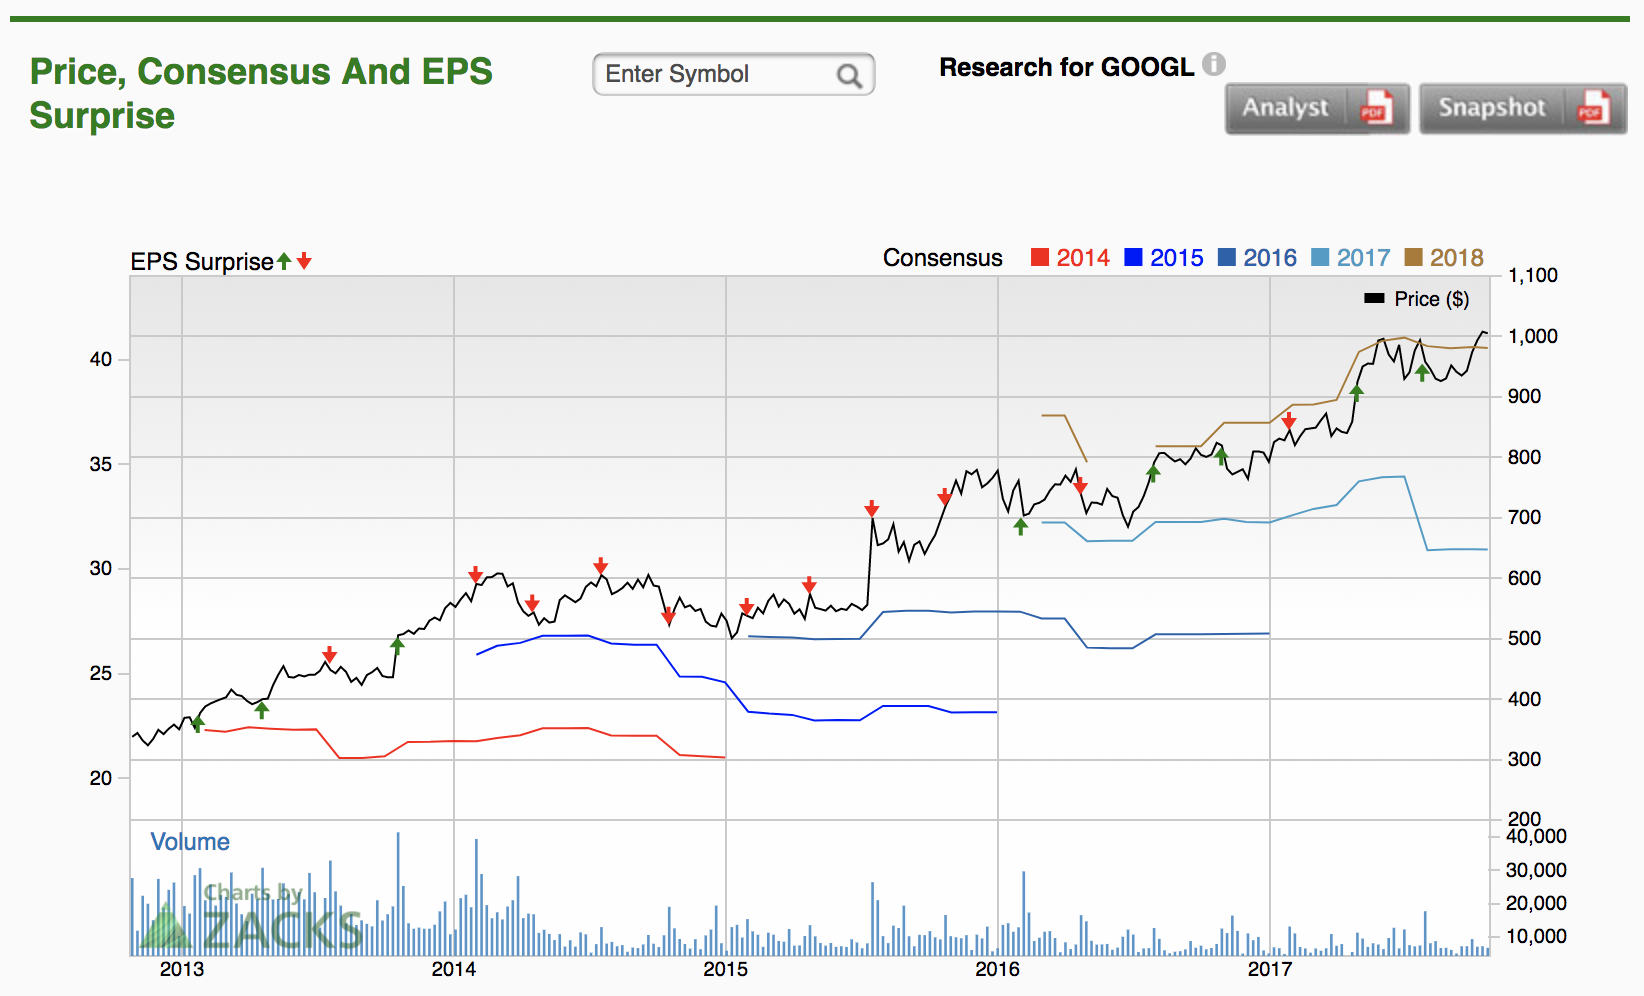
Alphabet Inc. (GOOGL)
Source: Zacks Investments
Overview
The price of a company’s stock is the expected value of its future earnings. This fundamental fact is what makes the field of earnings estimates so important in finance. Throughout each quarter, countless analysts use a myriad of financial metrics and calculations to try and determine different companies’ earnings per share targets. Different sources such as Zacks Investments, Morningstar, and even Yahoo Finance do a solid job of aggregating these analysts’ estimates.
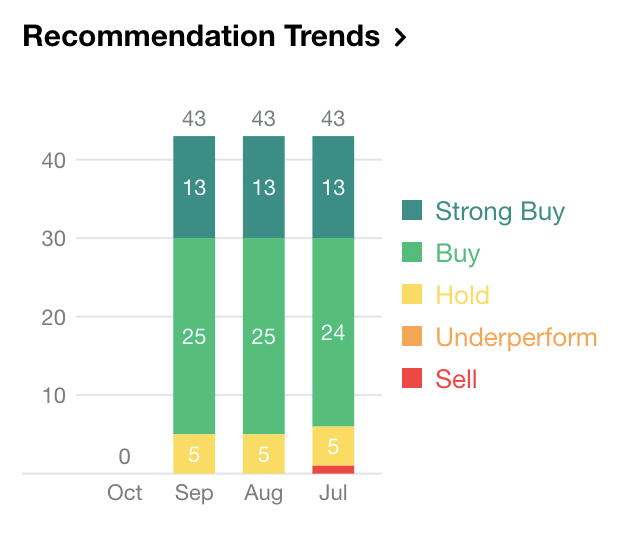
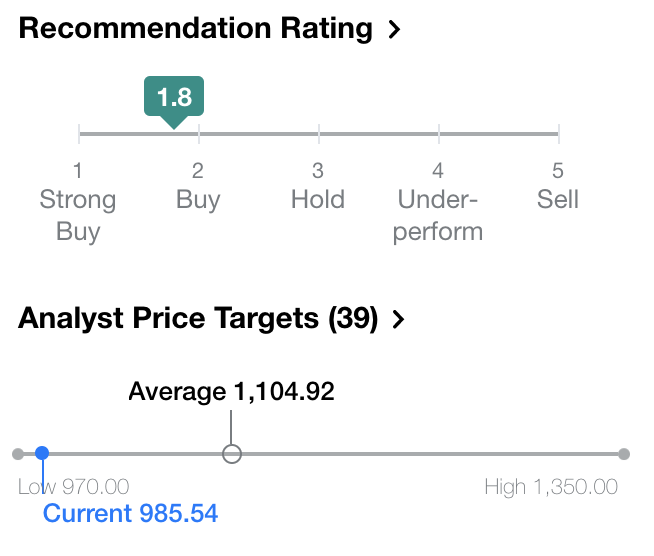
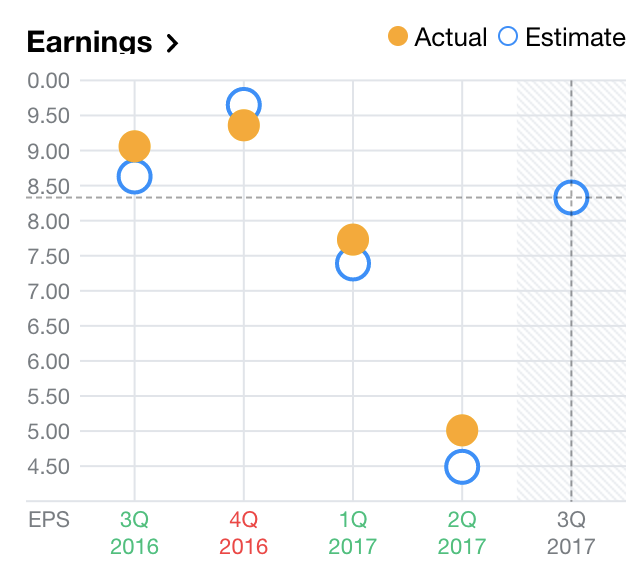
Alphabet Inc. (GOOGL)
Source: Yahoo Finance
The chart on the right made me approach earnings estimates through the lens of classification. From here, I wanted to see if the difference between actual and estimated earnings could be determined by various financial metrics.
Data
Initially, I wanted to classify whether a company’s earnings would be below, at, or above the consensus estimate. However, after pulling earnings and metrics data on all S&P 500 companies over the past 4 quarters, the classes were heavily unbalanced. The overwhelming majority of earnings estimates were above the actual estimate reports. Thus, I turned to the earnings surprise, or the percentage the actual earnings were above or below the consensus. Next, I needed to somehow categorize this target variable. To find a balance that was consistent with intuition, I chose a threshold of 5%. If the earnings surprise was 5% or less it was considered “close,” otherwise, it was “far.” This yielded a farily balanced data set, with a roughly 45:55 close-to-far ratio.
As for the independent variables, I wanted to use some of the more popular valuation metrics in my analysis. Due to web scraping restrictions, I was unable to get all of my desired variables. I was actually surprised how difficult it was to find accessible financial data that was not forward looking. In any manner, I was able to obtain some important variables such as bookvalue per share, free cash flow per share, interest coverage ratio, current ratio, quality of income, payout ratio, debt-to-equity ratio, and a few more. A good amount of these variables have natural categorical thresholds that are assumed as industry standards. For example, a current ratio below one signals that a company may not be able to pay their liabilities or comparing book value to market capitalization says alot about the value of a company. Therefore, I was able to categorize alot of these continuous variables.
Model
I ended up using a Random Forest Classifier. This model was able to handle the mix of continuous and categorical variables the best. It yielded an accuracy of around 61%, an AUC of 0.63, and the strongest convergence of the train and test sets. With all this said, this model is still not a great classifier when it comes to predicting the magnitude of earnings surprise. In the future, additional features and data would need to be used in order to get a better picture of what goes into earnings estimates.
Subscribe via RSS